- LPG Price Structure
There are many factors that go into determining the sales price of LPG and the following will describe all of these factors.
(1) World LPG Benchmark Pricing
LPG is an internationally traded commodity and influenced by international prices.
The international benchmark for the LPG is the Saudi Aramco Contract Price, also commonly called the CP.
The CP changes on a monthly basis, forcing price reviews at least once per month.
Indonesia does not have an influence on LPG price benchmarks, as Indonesian production of LPG is small compared to worldwide production.
- About Saudi Aramco Contract Price (CP)
In the 1980s and 1990s, Saudi Arabia, who supplied more than half of world LPG trading volume, had a decisive influence on international LPG prices.
As a result, global LPG trading is determined by Saudi Aramco Contract Price (CP).
As the current international price in the market, Saudi Aramco Contract Price (CP) is expressed in $US per metric tonne. The CP is set on the propane and butane commodity prices, and published on the first business day of the month and remains fixed for the remainder of that month.
The CP is fixed monthly by an in-house committee formed of Saudi Aramco’s sales and marketing experts. The formula is based on 4 (four) elements:
a. market sentiment,
b. spot market assessments,
c. the values of naphtha and crude oil,
d. 3 (three) monthly spot sale tenders the results of which Saudi Aramco keeps confidential.
(2) Exchange Rate
The CP is expressed in US dollars per tonne.
As the international price for LPG is in US dollars, the Indonesia Rupiah exchange rate also affects the Indonesian sales price of LPG.
Exchange rates change numerous times per day, making the setting and publishing of prices even more challenging.
(3) LPG Transportation Cost
Transport costs and refinery terminal fees are also a significant part of the overall cost of delivered LPG.
Indonesian LPG is sourced from oil & gas fields, refineries and importers.
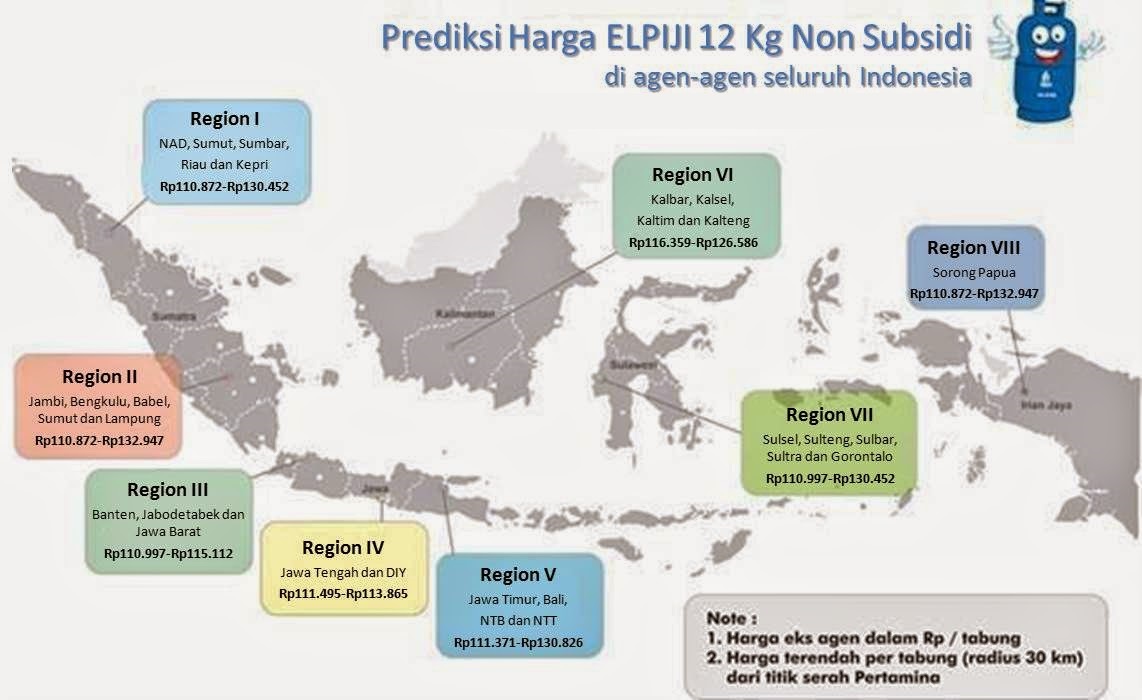
As these can vary across the different geographical locations of Indonesia, LPG sales price can also vary by location and distance from the source.
There are 3 (three) distance related transportation cost variables:
a. Distance from original source to the main terminal
b. Distance from the main terminal to the various local depots
c. Distance from the local depot to final location
(4) Volume Used
The cost of servicing a larger volume account is typically less than a lower volume account.
Delivering larger quantities, on a given delivery, is obviously more economical.
There are also equipment costs, account administration costs and other costs & considerations that, when spread across more volume, will affect the price.
As a result, the volume used affects the LPG sales pricing.
(5) Seasonality
The seasons can also affect LPG prices, as the worldwide demand is generally higher during the northern hemisphere winter.
In general, higher demand results in tightening of supplies and an increase in prices.
(6) Taxes
The government affects the price you pay for LPG through the application of taxes.
Value Added Tax (VAT) applies to all LPG Sales Price in Indonesia.
This adds 14% to the price of the LPG.
(7) Geo-Political Issues and Supply Interruptions
Embargos, wars and social unrest in LPG producing countries can adversely affect supply and drive prices upward.
Natural disasters, like earthquakes and fires, can also have an effect.

- PT Perta-Samtan Gas’s LPG Sales
PT Perta-Samtan Gas has produced LPG and sold to the buyer, namely PT Pertamina (Persero) Integrated Supply Chain/ISC.
PT Perta-Samtan Gas’s LPG sales price is determined by Saudi Aramco contract prices (CP) which are Propane (C3) and Butane (C4).
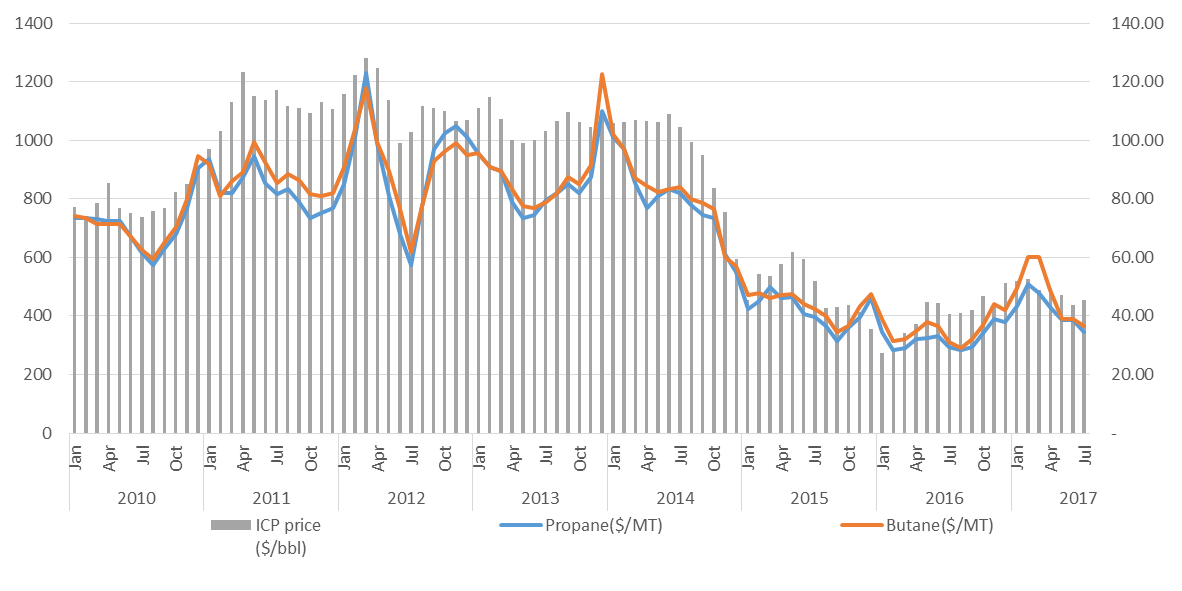
Herewith, Saudi Aramco Contract Price (CP) and Crude Price (ICP) records are described as below.
| Average Yearly Price – CP & Crude (ICP) | |||
| Year | Propane (USD/MT) | Butane (USD/MT) | ICP (USD/bbl) |
| 2010 | 707.90 | 717.50 | 79.40 |
| 2011 | 828.80 | 870.80 | 111.55 |
| 2012 | 914.60 | 917.90 | 112.73 |
| 2013 | 857.50 | 884.60 | 105.85 |
| 2014 | 790.80 | 810.40 | 96.51 |
| 2015 | 416.30 | 436.70 | 49.21 |
| 2016 | 323.30 | 355.80 | 40.16 |
| 2017 | 467.50 | 501.67 | 51.32 |
| 2018 (Jan~Oct) | 552.00 | 553.00 | 69.18 |


